




What Our Data Showed When We Tested Synthetic vs Human Respondents in a Brand Survey
In this article, we share evidence about the accuracy of synthetic data, and answer the following questions:
- How accurate are synthetic vs human respondents?
- Can AI accurately measure brand health and favorability?
- What happens when AI takes a live brand tracker survey?
- Can you apply a math formula to fix AI data inflation?
- Does the way you ask an AI model a question change the result?
As the debate over AI in market research heats up, leaders are asking us a critical question: What is the evidence for using synthetic respondents in research?
To find a substantive answer, we put synthetic vs human respondents in the same survey.
In Q4 2025, The Directions Group ran a head-to-head comparison embedded in our QSR (Quick Service Restaurant) Brand Momentum tracker, our ongoing fast-food brand health survey. This flagship study covers seven major brands. We ran the survey with 934 human respondents and 298 synthetic respondents.
The study gave us a direct, side by side comparison across awareness, favorability, and recommendation measures.
Here are the results.
Finding 1: Demographics Match
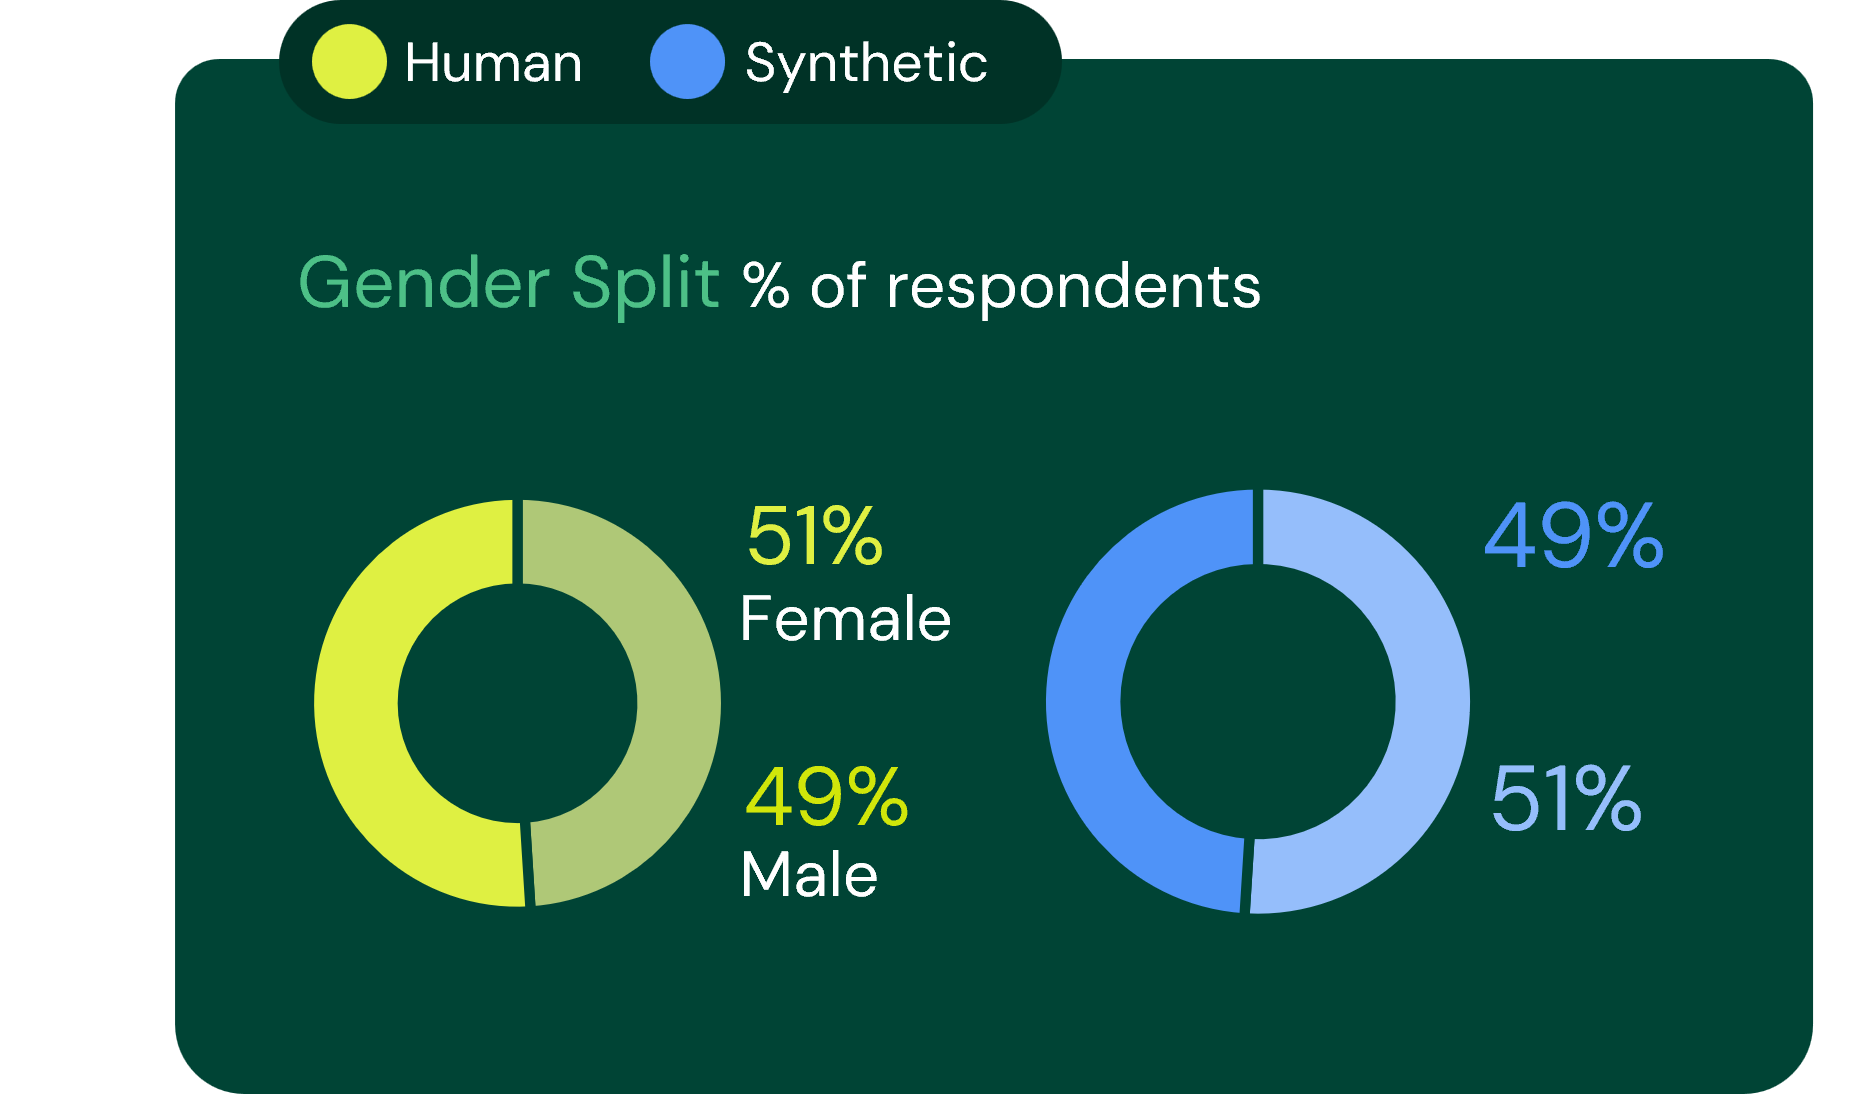
On basic structural questions, synthetic and human respondents came in nearly identical. The female to male split was 49 to 51 for synthetic versus 51 to 49 for human respondents. Age distributions tracked within two to three percentage points across almost every age group.
This is the result vendors lead with, and the data supports it. Synthetic respondents can be demographic mirrors of your target population. Demographic similarity tells you the sample looks right, but it does not tell you the sample thinks right.
Finding 2: Rank Order Mostly Holds. Absolute Levels Do Not.
When we looked at a core metric like "Definitely Would Recommend," the brand tracker synthetic data unraveled.
Synthetic respondents inflated top-box scores (the highest possible ratings) by 4 to 19 points across all seven brands studied.
The inflation was not uniform.
- Chipotle was inflated by 4 points.
- McDonald’s and KFC were inflated by 19 points each.
The brands with the largest AI bias were also the brands with the most online discourse. This is what you would expect if the AI was distorting its answers with public sentiment rather than simulating a real consumer decision.
Rank order was partially preserved.
Chick-fil-A leads in both samples. KFC and McDonald’s switched places when measured synthetically. That is a highly meaningful error if competitive positioning is the purpose of your study.
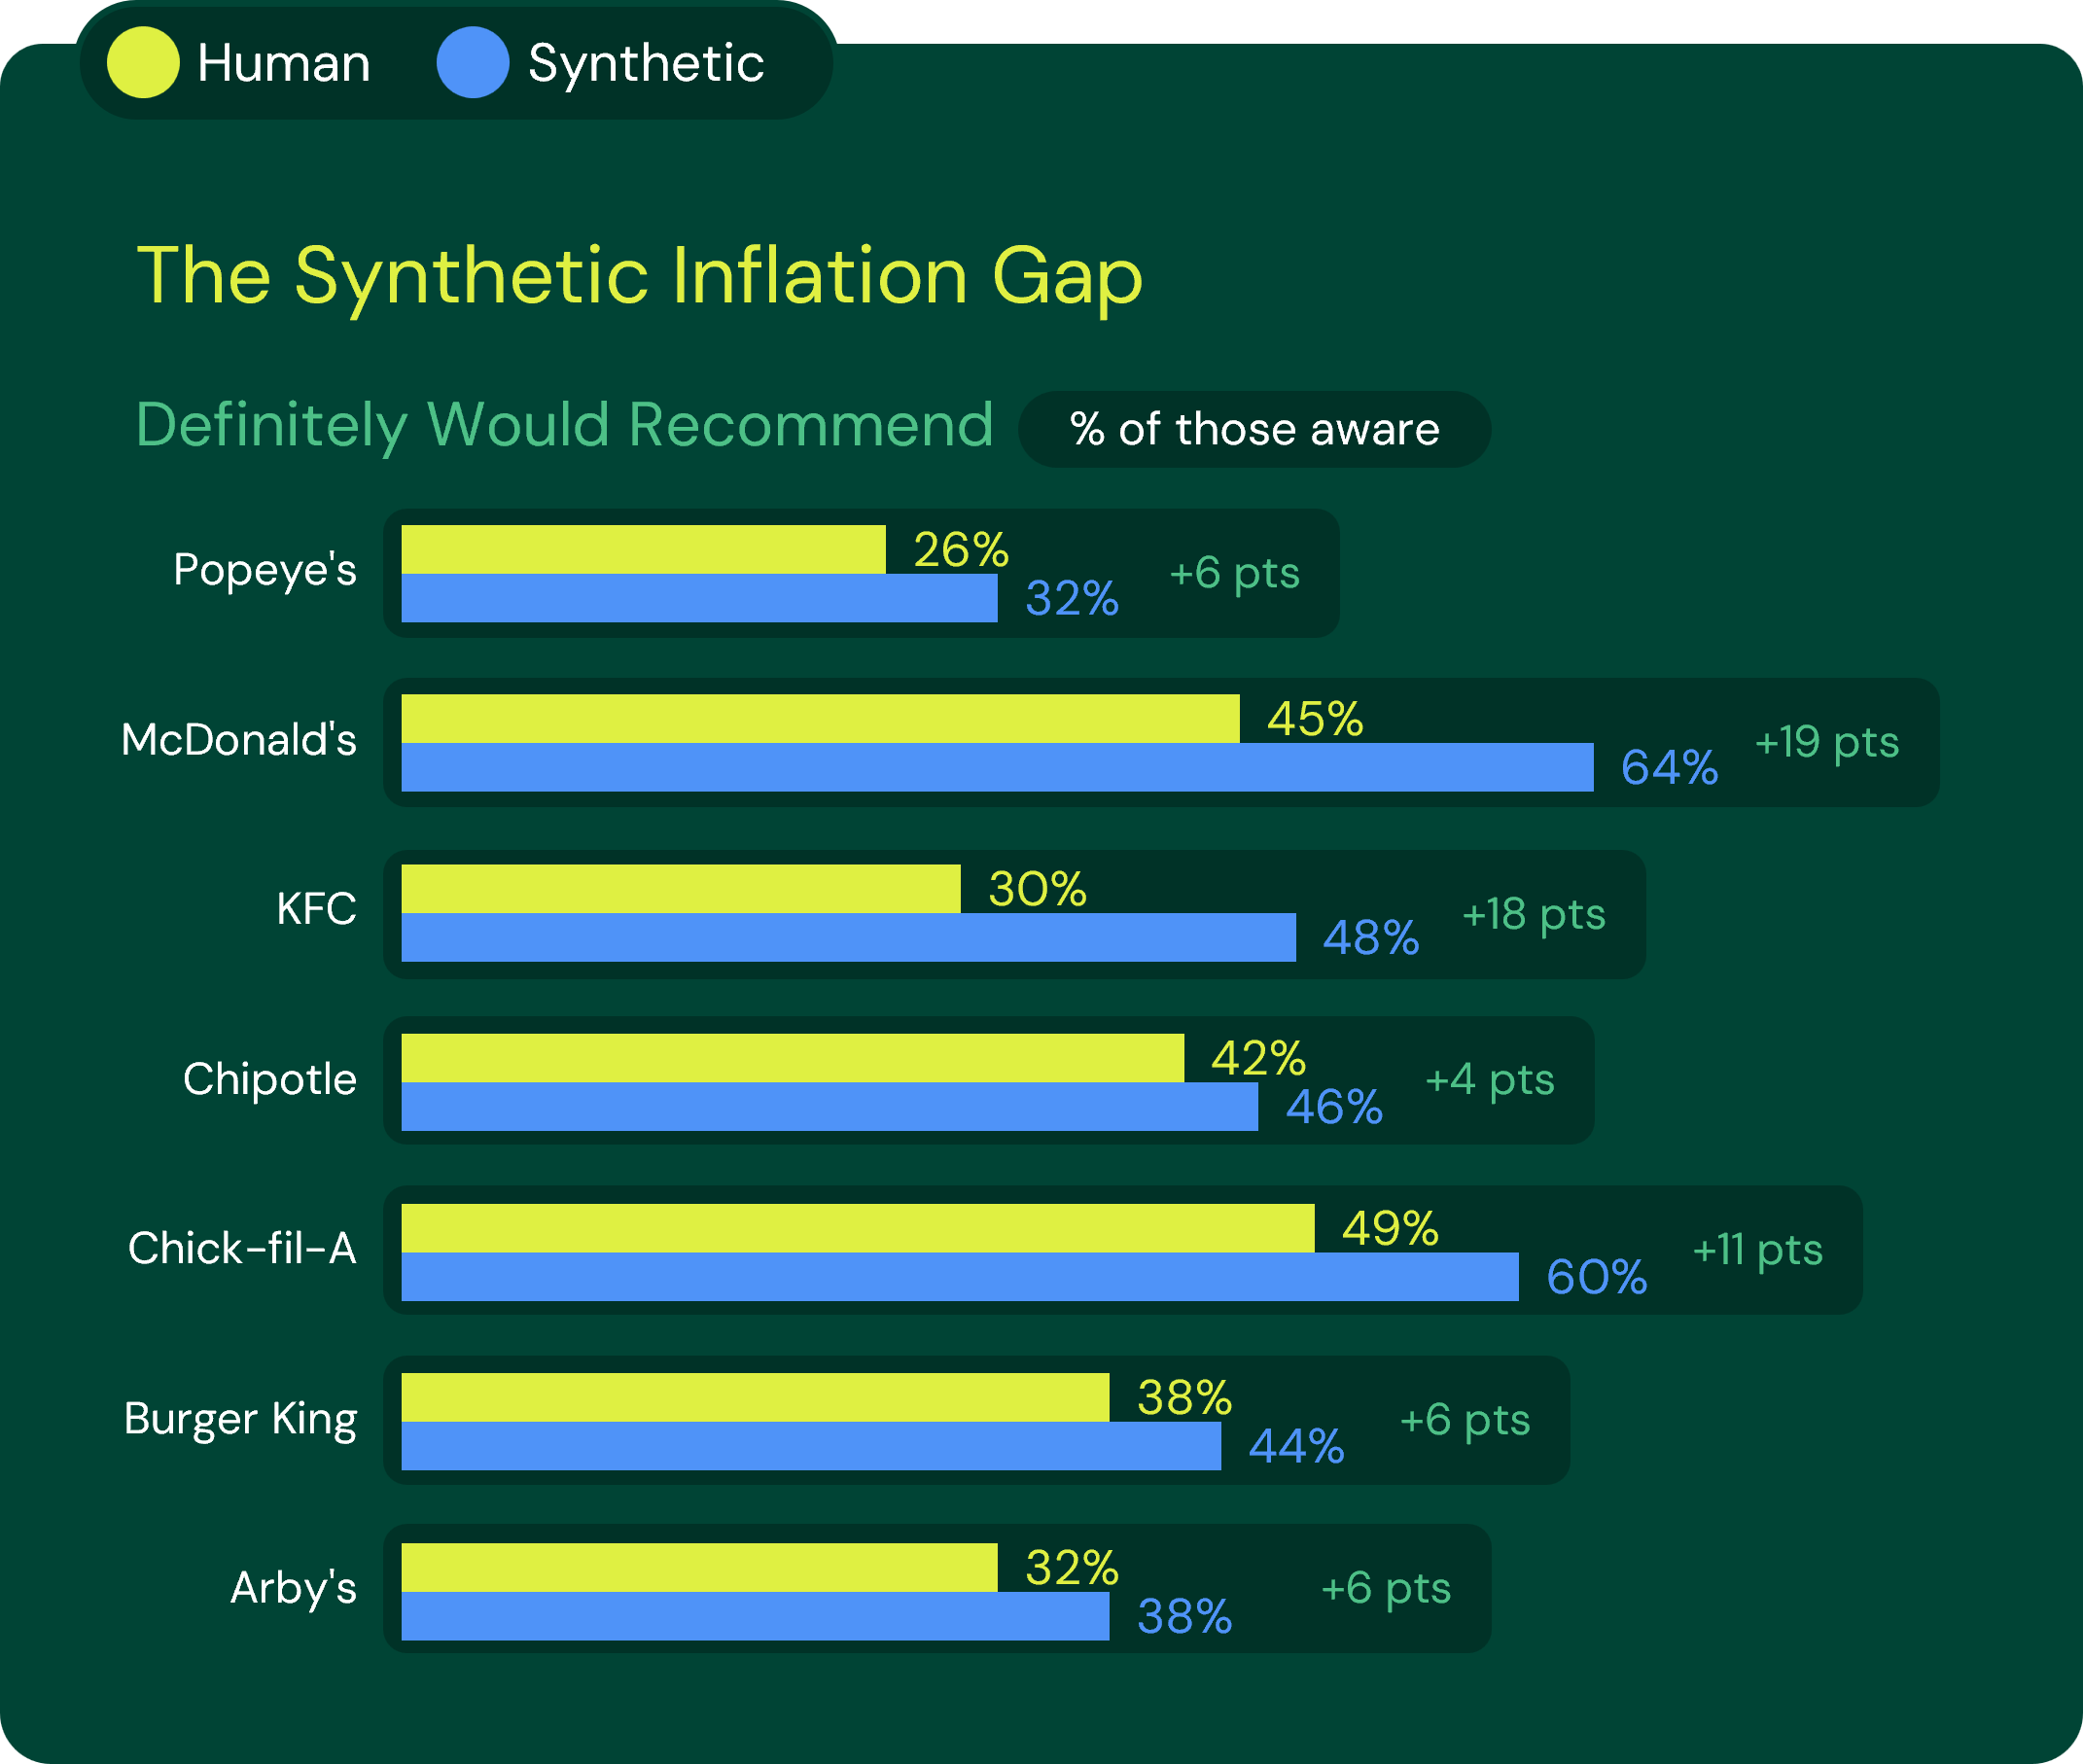
Perhaps most importantly, there was no reliable correction factor. Because the inflation varied five times across brands, a researcher cannot just subtract a standard offset to recover the human number.
A claim such as "rank order is preserved,” (offered by most synthetic-respondent vendors) needs to be qualified: it is preserved at the top but not stable across the middle of the distribution.
Finding 3: The Method Matters More Than the Model
Our findings align with the most credible academic validation of synthetic data accuracy to date. In 2025, a study run by PyMC Labs and Colgate-Palmolive tested AI-generated consumers against 9,300 human responses across 57 personal-care concept tests (tests of new product ideas). That study found that synthetic respondents achieved an impressive 90 percent relative to human product rankings.
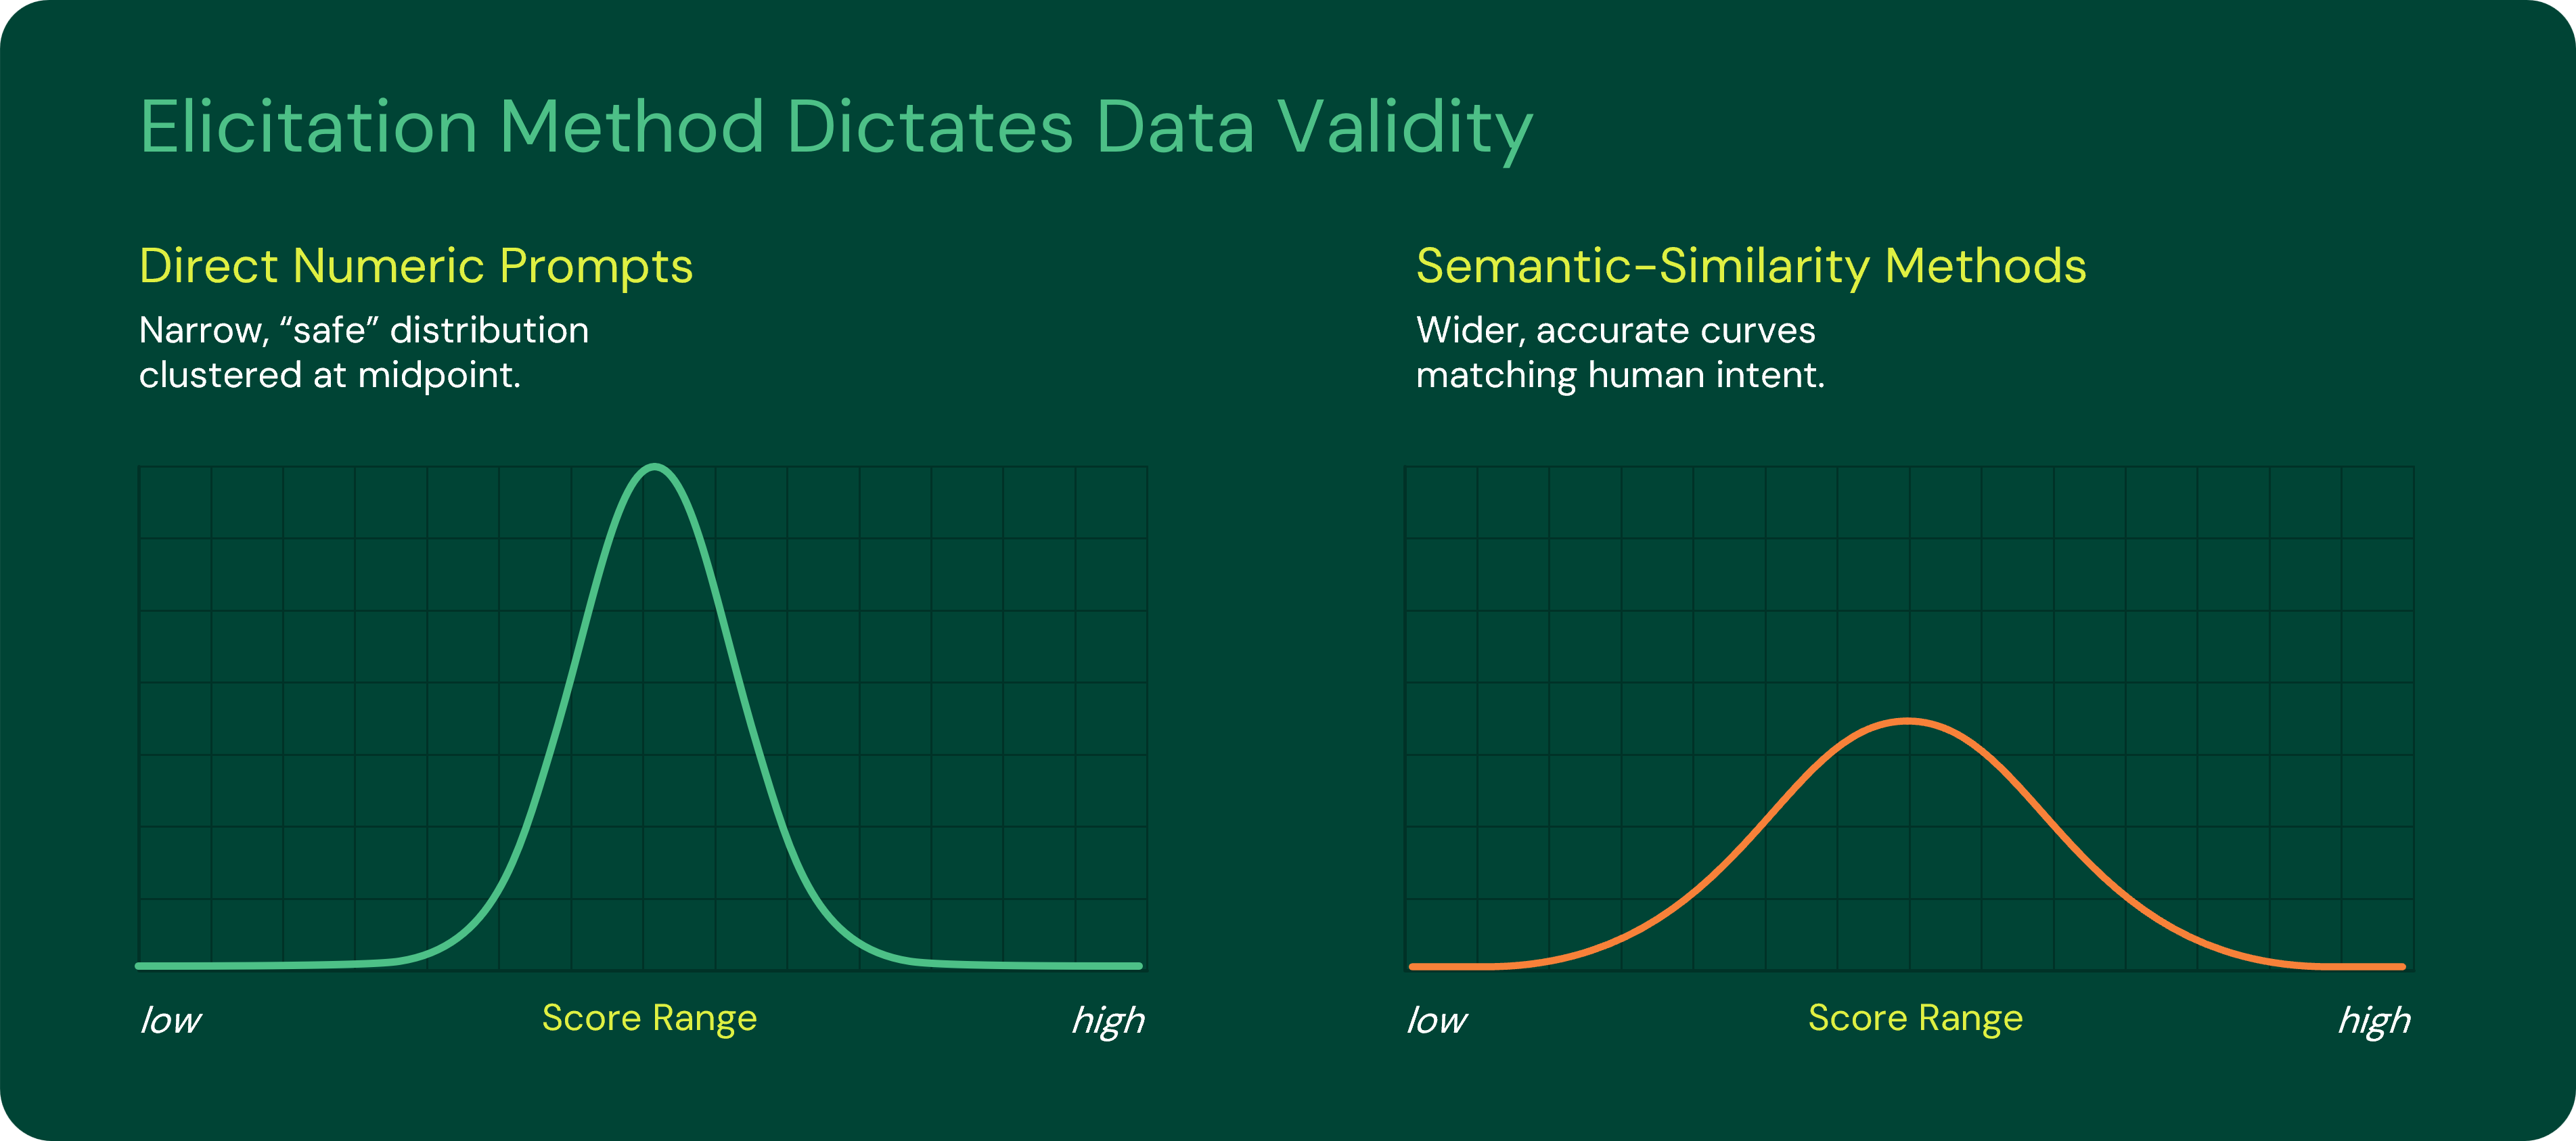
Those results required a highly specific method. When the researchers used direct numeric prompts (like asking the AI to rate something on a scale of 1 to 5), it produced safe, middle-of-the road answers, which replicated the findings other critics have identified.
LLMs reproduce human purchase intent when you ask them right.
To reach 90% relative accuracy, researchers had to ask the AI to write a free text response first, and use advanced natural language processing methods to map that text back to a rating scale (the semantic-similarity method). However, this method only works in domains where the LLM's training corpus is rich, when the question is rank-ordering preferences, and the questions themselves are done well.
In the research, the 90% level of accuracy was demonstrated in CPG personal care, and was not validated in B2B, healthcare-HCP, or low-incidence audiences.
What This Means for Your Research
If you are considering synthetic respondents for studies where relative order is the primary output, the evidence is genuinely encouraging.
For tasks such as narrowing 8 concepts down to 3 before launching full-scale fielding (a complete survey), or ranking 30 product features, there are real use cases with real support.
If you need absolute levels, synthetic data is simply not a substitute for real people.
If you are reporting brand awareness percentages, favorability scores, or recommendation rates as business metrics, our data makes the case clearly. The inflation is real, it is systematic, and it cannot be easily corrected.
The research profession deserves this level of honesty about a technology that vendors are actively selling as a time and cost saving solution. So, as we continue testing, we will continue publishing what we find.
To discuss how these findings apply to your specific research design, feel free to contact the Directions Group Centers of Excellence.
We help clients evaluate vendors, scope pilot designs, and put validation in place before any insight is finalized.
COMING SOON
In part three of this series, you’ll discover:
- Six strategic research tasks where the evidence supports using AI
- Four key areas where simulated data consistently fails
- Seven critical questions to ask any vendor before deploying AI
1. The Directions Group / Qualtrics. QSR Brand Momentum — Synthetic Report (Q4 2025). Comparative crosstab report; n=1,232 (934 human / 298 synthetic). Side-by-side human vs. synthetic for awareness (Q1), favorability (Q7), recommend (Q12), and concept-claim convincingness (Q24–Q25).
2. Chapman, C. (2026). Synthetic Survey Data? It's Not Data. Sawtooth Software Webinar Series, February 2026. Quant UX Association.
3. Maier, B. F., Aslak, U., Fiaschi, L., Rismal, N., Fletcher, K., Luhmann, C. C., Dow, R., Pappas, K., & Wiecki, T. V. (2025). LLMs Reproduce Human Purchase Intent via Semantic Similarity Elicitation of Likert Ratings. PyMC Labs (Tallinn) & Colgate-Palmolive (NY). arXiv:2510.08338v1, 9 Oct 2025.
Insights
Read More
Five Principles for Using Synthetic Respondents Responsibly
Synthetic Data Use Cases: Where AI Survey Takers Are Helpful and Where They Are Harmful
Don't Replace Your Human Sample Just Yet: An Evidence-Based Guide to Synthetic Respondents
Discover Linara: An Always-On Integrated Intelligence Platform
Introducing ARIN - An AI-Powered Survey Companion
The Directions Group and Idealyst Innovation Form Strategic Partnership
New Study Highlights Widening Lifespan-Healthspan Gap and Implications of Evolving U.S. Health Landscape
Directions Research, SEEK Company, and Aimpoint Research Unite to Form The Directions Group
Tim Urmston, Founder and President of Seek Company, Passes Torch to Courtney Pegan
Top Workplaces Seven-Year Streak!
Stacey Wetterer Joins Directions Inc
Introducing AMO - Adaptive Marketing Optimizer
Incoming President and CEO Elizabeth Finn Unveils Vision for Directions Inc
Directions Inc Announces Promotion of Elizabeth Finn to Chief Client Officer
Expanding Our Shopper Practice
Directions Sharpens Technology Focus With Dedicated Group
Directions Research Promotes Tim Laake To CMO
Directions Research Announces New President
Directions Inc President and CEO Jim Lane Announces Retirement
Directions Hires Operations Veteran Jason Ebbing
Aimpoint Research Joins Directions
Directions Expands Board Of Directors
Directions Announces Promotions Of Several Key Leaders
Cincinnati Marketing Research and Insight Firms Partner on New Internship Program To Promote Greater Diversity In The Industry


Get started
At The Directions Group, we’re passionate about turning chaos into crystal-clear understanding that will bring you closer to your customer and drive real results for your business.